Pre-disclaimer: You know how every year in school growing up, your math teacher would teach you some rules, and then the next year you’d learn those weren’t hard and fast rules as much as general principles that might not always be true? “You can’t take the square root of a negative” in Algebra I becomes “the square root of a negative number is a sorta-half-negative-thing that you just have to imagine” when you get to Algebra II, and you just go, huh, my teachers get paid to lie to me. I’m going to take the Algebra I approach in this post, so for industry old heads who might be reading this, please know that I’m speaking in generalities intended to help establish a basic understanding for folks who are newer to these concepts.
For example, if you go read the section discussing ISO/RTOs vs. vertically integrated markets and find yourself thinking, “Coop’s wrong! Not all of California is served by the CAISO grid, because SMUD and LADWP are separate balancing authorities in California that are technically part of non-CAISO WECC,” [1] then please:
a) know that I am indeed aware of this particular fact, and
b) step outside and touch grass, as the kids say.
[1] If you don’t know what any of this stuff means, congrats! You are the target audience for this blog post. You can learn about edge cases and complexities like this later on, after you understand the basics.
Okay, let's get into it.
s/o imgflip.com for the meme template :)
Energy vs. Capacity (this one never gets old!)
In most US ISO/RTOs (see the next section), wholesale electricity is sold via two main products, each with their own distinct market: A short-term market for day-ahead and real-time energy, and a long-term market for capacity. Energy consumption is the "area under the curve," in kilo/mega/giga/terawatt-hours, while power, load, or capacity is instantaneous power draw, in kilo/mega/giga/terawatts. In other words, power is the first derivative of energy.
What does this actually mean? A watt is a joule (a unit of energy) per second – in other words, a rate of energy use – so a watt-hour is actually (Joule / second) * (1 hour), where 1 hour is 3600 seconds, meaning that there are 3600 joules in a watt-hour. So:
When you see a unit ending with -watt (kilowatt, megawatt, gigawatt, terawatt), that’s a rate of electricity production, delivery or consumption – which we can call power, capacity, or load.
When you see a unit ending with watt-hour (kilowatt-hour, megawatt-hour, etc), that’s an amount of electricity produced, delivered, or consumed – which we call energy or generation.
For example, a large data center might top out at a load (a rate of energy consumption at any given point in time) of one gigawatt. If this rate stays the same for a full hour, the amount of energy consumed is one gigawatt-hour, reflecting the rate of consumption multiplied by the length of time during which which that rate of consumption applied.
What are ISOs and RTOs?
ISOs are Independent System Operators and RTOs are Regional Transmission Operators – two names for the same thing. ISO/RTOs are large not-for-profit grid operators that run the liquid North American power markets, which are, generally from west to east:
CAISO (California)
AESO (Alberta)
ERCOT (Texas)
SPP (Great Plains, Southwest, and parts of the South)
MISO (Midwest, parts of the South, and Manitoba)
PJM (Midwest and Mid-Atlantic)
IESO (Ontario)
NYISO (New York)
ISO-NE (New England)
What is a liquid market? You’ll often hear these referred to as “deregulated” markets, but “restructured” or “disaggregated” is more accurate, because all power markets are regulated to some extent. Plus, when you say “deregulated power market,” folks of a certain age are likely to hear “Enron.” See meme below.
Source: https://www.reddit.com/r/HistoryMemes/comments/ofq7pv/the_enron_ethics_book_wasnt_totally_useless_great/
Anyway… Liquid markets are regions of the grid in which non-utility companies are permitted to build and own large-scale generation facilities and sell their energy on a competitive wholesale market. These non-utility generation firms are called independent power producers (IPPs). Traditional utilities still exist, and may even own some legacy generation assets depending on the rules of the relevant ISO/RTO, but in an ISO/RTO market, utilities’ main role is to provide transmission and distribution (T&D) service, which means getting the energy from where it’s generated to where it’s consumed by owning and operating the poles and wires. At the regional scale, operation of utility-owned transmission lines is handled by the ISO/RTO, which is responsible for connecting buyers and sellers of power by applying wholesale market rules to transmission system operations.
What’s the Alternative to ISO/RTOs?
The alternative to a liquid market is (duh) a non-liquid market. You’ll hear this referred to as a “regulated” market sometimes, but that term is not very helpful, since, again, even “deregulated” markets are also subject to some amount of regulation. “Vertically integrated” is a much better way to refer to non-liquid markets. The core distinction vs. ISO/RTOs: In vertically integrated markets, utilities have a regulated monopoly on generation (or at least procurement) of electricity, not just on transmission and distribution. IPPs can still try to make money in these markets by either building assets that they then sell to the monopoly utility (build-and-transfer) or by signing a long-term agreement to supply the utility with power (PPA), but being forced to sell to a single customer is generally much less attractive for IPPs than being able to sell directly to many potential end users via a liquid wholesale market, all else equal. Moving from west to east again, the North American vertically integrated markets are:
Alaska (ASCC)
British Columbia (BC Hydro)
Western US excl. California (Various utilities within non-CAISO WECC)
Mexico (CFE/CENACE)
Saskatchewan (SaskPower)
Southeastern US (Various utilities within SERC)
Québec (Hydro Québec)
Rest of Canada (Various utilities)
So, now that we’ve established the difference between energy and capacity, and between liquid and non-liquid markets, how are energy and capacity bought and sold in the liquid markets?
The Energy Market
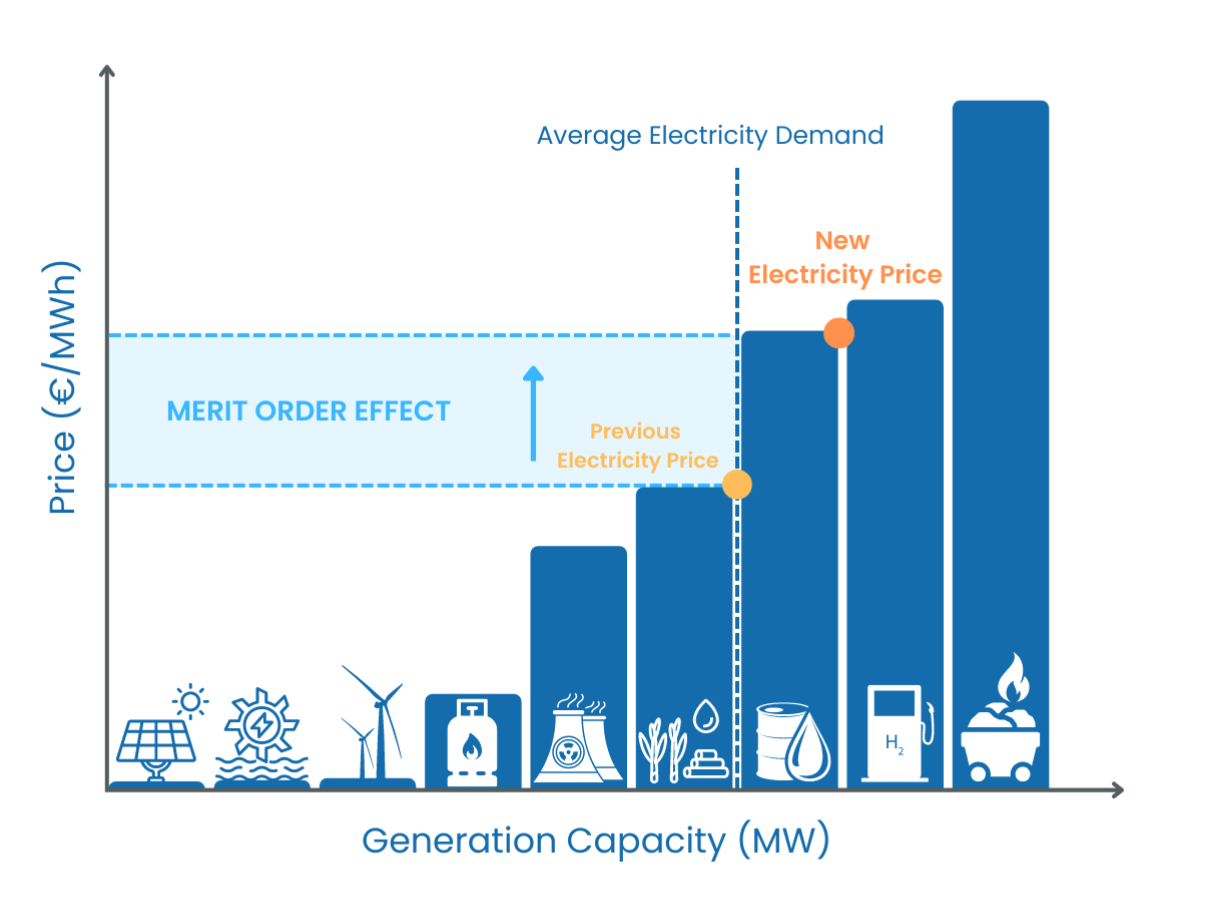
In the energy market, intended to meet near-term power supply needs, generators bid their marginal cost, or something very close to it, into day-ahead or real-time markets at certain time intervals: Usually by the hour for day-ahead and every 5 to 15 minutes for real-time. The ISO/RTO “stacks up” bids from cheapest to most expensive and, starting from the lowest bid, tallies up the offered amounts of energy until it has enough energy to serve the market demand in a given time block (the “merit-order dispatch curve,” or, more informally, the “supply stack”). The market-clearing price is determined by the most expensive bid that is required to meet the market’s demand (the “marginal bid”). All of the cheaper resources then receive that same market-clearing price, and all dispatched assets make an operating profit during that time block, except the marginal asset that set the market-clearing price – assuming that it bid in at marginal cost, it just breaks even.
For example, consider a hypothetical grid with 4 natural gas power plants sized at 1 GW each. The four gas plants have marginal costs (therefore wholesale market bids) of $50, $100, $150, and $200 per megawatt-hour, respectively. The market operator forecasts that they need to serve 2 GW of load for the next hour, so they will “dispatch” (procure energy from) the cheapest bid offered first, at $50/MWh (or $50,000/GWh if you want to keep the units consistent), then the second-cheapest, at $100/MWh, but they will not dispatch the third, because after dispatching the first and second 1 GW plants for the next hour, they’ve already gotten the 2 GWh they needed. They will pay both dispatched units $100/MWh, so the more expensive price-setting (“marginal”) unit will cover its variable opex, while the cheaper unit will make a $50/MWh operating profit, which is the difference between its revenue and marginal cost.
Renewables in the Energy Market
Now, say there’s a solar project added to the grid that is also 1 GW in size. Because solar is non-dispatchable (you can’t turn it on and off on command), and because it has no variable operating costs (it doesn’t need fuel), solar assets typically submit a bid of $0/MWh. As with the natural gas plants, the solar plant is setting price equal to marginal cost, which in practice just means it is the cheapest source in the supply stack and, as long as the sun is shining, it takes the market-clearing energy price, so long as that market price is not negative. Let’s assume demand stays the same, with the solar asset added to the grid, and that this particular hour with 2 GW of demand is in the middle of the day when the sun is shining. What happens? Well, starting with the lowest-cost bids and dispatching up the merit-order curve until they’ve met demand, the ISO first dispatches the 1 GW of solar, since its bid was zero. Then it dispatches the cheapest gas plant, which bids $50/MWh. Together, those two plants are enough to meet demand, so the market clears at $50/MWh, the solar plant makes an operating profit of $50/MWh, the cheapest gas plant breaks even by earning back exactly its marginal cost of $50/MWh, and the $50 lower clearing price means the second-cheapest gas plant that was previously dispatched is no longer needed. The prevailing price on the grid is cheaper as a result.
The merit-order dispatch curve, with the addition of zero-bidding renewables at left resulting in a lower market-clearing price to meet demand. Source: https://synertics.io/blog/5/a-look-at-the-merit-order
And if the market-clearing price is negative, which happens when the grid is oversupplied or when transmission congestion in certain areas means that it costs more to get energy from A to B than the actual value of the energy once it can be sold at B [2], then solar assets will “curtail,” or turn off, because they would rather not pay to send energy to the grid when they could just flip the off switch for free. Dispatchable units may also curtail during these periods, but startup and shutdown for natural gas, coal, and nuclear assets come with costs, so it may be better for these traditional generation resources to swallow negative pricing for an hour or two rather than having to shut down and later restart.
[2] Where A is the location at which the solar plant connects to the grid, called the “node,” and B is a large, liquid place elsewhere on the grid at which traders settle their energy transactions, called the “hub.”
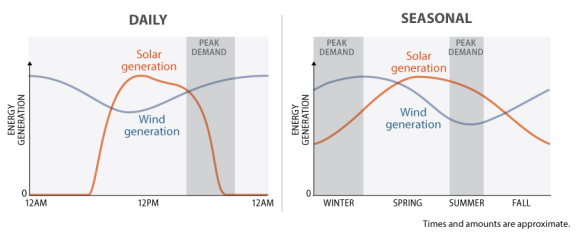
Also, the $50/MWh clearing price scenario I’m using here is a very simple example assuming full output from the solar plant, which is relatively rare. Without going too much further into the weeds, power plants have what’s called an “hourly generation profile,” which you may also hear referred to as an “8760” (the amount of hours in a non-leap year. Again, you only get solar power during the daytime, and you get more of it when the sun is higher in the sky and therefore is not being scattered through as many layers of atmosphere. And of course, clear skies are better than clouds for solar production.
Daily and seasonal solar and wind generation profiles. Source: https://www.everycrsreport.com/files/20190610_R45764_50945c0f4fbabb031186e406944719d56a16dcff.html
Taking this all into account, a solar 8760 will typically look like a sine wave subject to a zero lower bound, with generation each day starting up around sunrise, increasing until the early afternoon, and then decreasing back to zero around sunset. Maybe you’re generating energy at close to the nameplate DC wattage of your panels for an hour or two, but you’ll be at a lower level of output outside the prime hours, which is reflected in solar’s relatively low AC capacity factor of about 15-30%, vs. more like 35-45% for wind and possibly upwards of 60% for baseload thermal assets like combined cycle gas (CCGT) and nuclear. Capacity factor is defined as the actual annual energy production of an asset divided by its theoretical maximum annual production, i.e. its full capacity (in megawatts) multiplied by 8760 hours. So, if I’m building a solar plant that is sized at 100 megawatts AC, and I expect it to produce 220,000 MWh of energy in a year, that means my annual capacity factor will be 220,000 MWh / (8760 h * 100 MWac) = 25.1%. The higher a solar plant’s forecasted capacity factor, the more attractive it will be to build, all else equal, because you’re getting more production (revenues) out of the same equipment (capex). Of course, all else is never equal, but projected capacity factor [3] is always a key input to renewable project development and investment decision-making.
[3] Or production, or specific yield – different ways of measuring the same thing.
The Capacity Market
In the capacity market, designed to meet long-term power supply needs, generators bid whatever price they want into a pool of assets that are committing to be online and available to serve load throughout a given system planning year or set of years. The auction works the same way as the energy market, with bids accepted from lowest to highest cost until the ISO/RTO has procured enough capacity to meet its reliability requirements (more on what this means below). The ISO/RTO is therefore a monopsony – a sole buyer of capacity – rather than simply being a transaction facilitator between buyers and sellers, as it is for real-time and day-ahead energy. But, since ISO/RTOs charge standard fees (called “tariffs”) for the use of the transmission lines they manage, energy users are actually the ones funding the capacity market as well, albeit through the ISO/RTO’s centralized capacity procurement mechanism.
How does an ISO/RTO “meet its reliability requirements?” This is generally done by procuring an amount of capacity equal to the system’s peak demand plus its planning reserve margin (PRM), usually expressed as a percentage of system peak It’s a measure of how much “spare” capacity is able to serve load at any given moment. For example, let’s look at that same market with four natural gas power plants. Say the market operator forecasts a system peak load of 2.5 GW with a planning reserve margin (“PRM”) of 20%, meaning it’s required to procure capacity accounting for 120% of the forecasted peak demand, or 3 GW, to provide a margin of safety that ensures the lights stay on even if instantaneous load on the system is significantly higher than expected or a generator trips offline unexpectedly. Now, the 4 power plants bid their capacity in the market at a price per kW-month (they want to get paid this amount for each month that 1 kW of their plant’s capacity is made available to the grid):
1. Plants A and B (the ones with the lower $/MWh marginal costs and energy bids) bid $0/kW-month, as they expect to make most of their money from selling energy in the short-term market given their low marginal costs, so they don’t need to make anything from the long-term capacity market to stay in the black.
2. Plant C (with a higher $/MWh cost/bid in the energy market) bids $15/kW-month, as it needs to recover some amount of money from the capacity market to achieve its target returns for investors, since its energy price is less competitive and it will therefore be dispatched to provide energy less often than cheaper plants A and B
3. Plant D (with the highest energy cost/bid) bids $25/kW-month, as it needs to recover almost all of its target annual revenue from the capacity market because it is so rarely “in the money” (dispatched) in the energy market – it only turns on when scarcity conditions drive very high energy pricing, so it’s dependent on “getting paid just in case it’s needed” via the capacity market.
Again, the market operator evaluates the bids in order of price, and here we see the 3 GW reserve margin target is hit at the price of $15/kW-month, which Plants A, B, and C will receive. Plant D does not “clear” the market as its offer is above the market-clearing price. If this happens a few years in a row, Plant D will be decommissioned and will exit the market, since its marginal cost is too high to be competitive in the energy market and its annual revenue requirement is too high to be competitive in the capacity market.
Renewables in the Capacity Market
So what happens to the capacity market when we add the 1 GW solar asset onto the grid along with the four 1 GW gas assets? It depends on what market you’re in, but generally ISO/RTOs recognize that 1 GW of solar does not provide the same capacity to the grid as 1 GW of gas, because you can turn gas on and off whenever you want (with some limitations), while you only get solar when the sun is shining. Therefore, the solar asset shouldn’t get paid for its entire 1 GW size, even if its capacity bid clears in the market (i.e. is less than or equal to the marginal bid that sets the price for the whole market). Instead, ISO/RTOs will do what’s called a “capacity derate.”
Typically this is done by multiplying the asset’s nameplate capacity (the theoretical maximum it can deliver to the grid) by the asset’s effective load carrying capability, or ELCC. ELCC is expressed as a percentage of nameplate, and is set by each ISO/RTO to capture different technologies’ (solar, wind, battery storage, natural gas, coal, nuclear) ability to serve load during peak demand periods. This is sort of like a capacity factor, except it measures an asset’s actual production as percentage of theoretical output only during peak demand periods, rather than throughout the whole year.
How meaningfully do ELCC-driven capacity derates affect renewable projects’ revenue potential? Well, research from the National Lab of the Rockies (known as NREL in happier times) puts current marginal solar PV ELCC – the value for a new solar project coming online now – at or below 10%, meaning that if you have a 100MWac PV plant connecting to the grid this year, you’ll only get paid for 10 MW worth of capacity. This varies by region: The authors do note that marginal ELCCs for solar PV are higher than 10% in the Great Plains ISO/RTOs, SPP and MISO, where wind is the dominant renewable resource and there is less solar to cannibalize capacity revenues by reducing system net demand (gross demand less variable renewable generation) during sunny daylight hours – meaning that the peak demand periods used to determine ELCC occur when the wind isn’t blowing. Since wind generation is generally stronger at night, that means SPP is more likely to be undersupplied during the day, so the marginal daytime capacity added by solar in SPP is actually significant, for now. SPP PV ELCCs are currently between 56% and 74% for the summer 2026 capacity period, although no one expects these elevated values to persist for long, as substantially more SPP solar will come online within the next few years.
The bottom line is that, while capacity revenues are often a big part of the economic equation for dispatchable technologies like natural gas and nuclear, no one really expects solar or wind to make much money from capacity, unless they’re paired with battery storage. So when IPPs try to make a renewables project pencil out, they’re relying on selling energy, often bundled with per-MWh renewable energy certificates (RECs), to provide 100% of meaningful near-term income. Then there’s additional upside when the initial PPA ends and asset “goes merchant,” as its debt will be largely or entirely paid down at this point and it can capitalize on potentially higher spot prices by selling into the liquid wholesale markets, assuming it’s located within an ISO/RTO. Capacity is only a meaningful economic driver for wind or solar projects that are paired with battery storage, since a 2- or 4-hour battery massively enhances the dispatchability of a project relative to a solar- or wind-only asset.
What Else?
Here’s some stuff we didn’t touch on in this basic overview. Maybe we’ll come back to it in a future blog? Maybe I don’t know enough about any of these things to actually write said future blog? TBD. For now, in case you want to plug these into your AI chatbot of choice (I recommend this one):
The relationship between apparent power, real power, voltage, and amperage
Locational marginal pricing and congestion charges in liquid markets
Why are solar project capacities larger in DC than in AC, and what is inverter clipping?
Why do certain renewable projects (especially wind) bid negative prices rather than zero? Why do they sell energy to the grid in certain negative-priced hours rather than curtailing? How do these questions relate to the federal Production Tax Credit (PTC)?
Seasonal and monthly capacity pricing
What does it mean that the ERCOT and AESO markets are “energy-only?” How do these grid operators meet their reliability and reserve margin targets without a capacity market?
What does it mean that the SPP capacity and CAISO resource adequacy markets are “bilateral?” How do these grid operators meet their reliability and reserve margin targets without a capacity auction?
The detailed mechanics of virtual PPAs and the concept of basis risk
Where does battery storage fit into all this talk of capacity factor and ELCC for renewable projects?
That’s all for now! Thanks for reading.
-Coop
Standard Disclaimers
This blog post is written in my personal capacity and reflects only my own thinking, research, experience, and opinions.
This blog post is not sponsored by, endorsed by, or affiliated with my employer, although its content may be informed by some non-confidential aspects of my work.
This blog post is not investment advice and does not constitute any offer, solicitation to offer, or recommendation of any investment product or security.
This blog post is 100% human-researched, drafted, and edited. AI was not used in any capacity.
Want to weigh in with your thoughts? Propose a correction or improvement? Find me on LinkedIn or shoot me an email: cwetherbee at alumni dot gsb dot stanford dot edu.